
Ethereum’s native cryptocurrency, Ether (ETH), experienced a significant rebound over the recent weekend, pushing its price back above the critical $2,300 threshold. This upward movement, which saw ETH climb by 20% from a local low of $1,940 on March 29 to reach $2,330 on Saturday, has not only re-energized market sentiment but also propelled large institutional investors, often referred to as "whales," back into a state of profitability. The recovery has sparked intense discussion among analysts and traders regarding the potential for ETH to extend its rally towards the elusive $3,000 mark, a level not seen in months.
The catalyst for this impressive turnaround appears to be a confluence of factors, notably the widely reported announcement of a two-week ceasefire between the United States and Iran. Geopolitical de-escalation frequently injects optimism into global financial markets, with risk assets like cryptocurrencies often benefiting from reduced uncertainty. Alongside this external stimulus, a strengthening internal market structure for Ethereum has provided a robust foundation for the price appreciation. Data from TradingView illustrates the sharp ascent, underscoring the rapid shift in market dynamics.
Whale Profitability: A Historical Precursor to Rallies

A particularly compelling indicator of potential further upside comes from the analysis of whale activity. According to insights from CryptoQuant, the unrealized profit ratio for wallets holding substantial amounts of Ether—specifically those with over 100,000 ETH—has flipped back into a "profitable state." CryptoQuant analyst CW8900 highlighted the historical significance of this shift in a recent Quicktake note, stating, "In the history of $ETH, every point where they turned from loss to profit was at the rally start point." This observation suggests that the current market phase could be mirroring past patterns that preceded significant bull runs for Ethereum.
The concept of "whales" in cryptocurrency markets refers to individuals or entities that hold exceptionally large amounts of a particular digital asset. Their movements are closely watched because their substantial holdings mean their buying or selling actions can significantly influence market prices. When these large holders move from an unrealized loss position to an unrealized profit position, it often indicates that they held through a period of decline and are now seeing their investments recover. Historically, this return to profitability for whales has been a strong signal of renewed market confidence and a precursor to broader market rallies, as it suggests conviction among the most influential participants. The chart depicting ETH whales’ unrealized profit ratio clearly illustrates these turning points, showing a consistent correlation between whales regaining profitability and the initiation of upward price trajectories.
Deep Dive into Accumulation: Long-Term Investor Conviction
Beyond the immediate profitability, the underlying behavior of large investors reveals a deep-seated confidence in Ethereum’s long-term potential. The shift in whale profitability is intrinsically linked to a sustained pattern of accumulation at lower price levels, a trend that has been diligently tracked by on-chain analytics platforms.

Data from CryptoQuant reveals that a significant accumulation phase for Ether began in late 2025 and intensified aggressively throughout early 2026. This accumulation is observed in "accumulation addresses"—wallets characterized by continuously receiving ETH without making any outgoing transactions. These addresses typically belong to long-term holders, strategic institutional investors, or other entities focused on accumulating Ether for its intrinsic value and future prospects rather than engaging in active short-term trading.
The scale of this accumulation is remarkable. The total amount of ETH held by these long-term accumulation addresses has reached an unprecedented record of 26.3 million tokens. This represents a staggering 32% increase in 2026 alone, a period during which the price of ETH actually declined by 25%. This divergence—rising accumulation amidst falling prices—is a powerful indicator of strong investor conviction, suggesting that large players view price dips as opportunities to acquire more Ether, betting on its eventual appreciation.
Historical precedents further bolster the significance of this accumulation trend. For instance, on June 22, 2025, Ethereum accumulation addresses recorded a then-all-time high daily inflow of over 380 million ETH. This massive influx was followed by a nearly 85% price rally for ETH approximately 30 days later. A similar pattern was observed in November 2025, where another substantial spike in inflows to accumulation addresses preceded a significant price increase. These historical correlations underscore the predictive power of accumulation trends, positioning the current surge in accumulation as a strong bullish signal for Ether’s future price trajectory. The chart detailing ETH inflows into accumulation addresses vividly captures these periods of heightened buying activity, while the ETH balance held by accumulation addresses chart highlights the steady, upward march towards new record holdings.
Technical Setup: Charting a Course to $3,000

From a technical analysis perspective, Ether’s price action has formed a compelling pattern that further supports the bullish outlook. On the 12-hour chart, ETH has carved out a "rounded bottom" chart pattern. This formation is typically interpreted as a reversal pattern, signaling a transition from a downtrend or consolidation phase to an uptrend.
Currently, the price is retesting the $2,140 support level, a crucial juncture where the chart’s support line converges with the 20-day exponential moving average (EMA). The EMA is a widely used technical indicator that gives more weight to recent prices, making it a responsive measure of trend direction. The confluence of these two support indicators at $2,140 suggests a robust floor from which bulls are expected to launch their next offensive.
The immediate objective for bulls is to propel ETH/USD above the neckline of this rounded bottom pattern, situated at $2,400. A decisive break above this resistance level would confirm the pattern’s validity and pave the way for a significant upward move. The measured target for this pattern is projected at $2,940, representing a potential 32% increase from the current price levels. This target aligns closely with the highly anticipated $3,000 psychological barrier, making it a critical milestone for Ether’s recovery. The ETH/USD 12-hour chart clearly delineates this rounded bottom pattern, the neckline, and the projected target.
Further reinforcing the bullish technical picture is the Relative Strength Index (RSI). The daily RSI, a momentum oscillator that measures the speed and change of price movements, has risen notably from near-oversold levels at 36 to a healthier 57. An RSI reading below 30 typically indicates an oversold condition, while a reading above 70 suggests overbought conditions. The move from 36 to 57 indicates a significant return of buying interest and momentum, suggesting that ETH bulls are actively re-entering the market and driving prices higher. This resurgence in buying pressure is a strong affirmation of the underlying strength observed in the on-chain metrics.

Potential Headwinds and Critical Resistance Zones
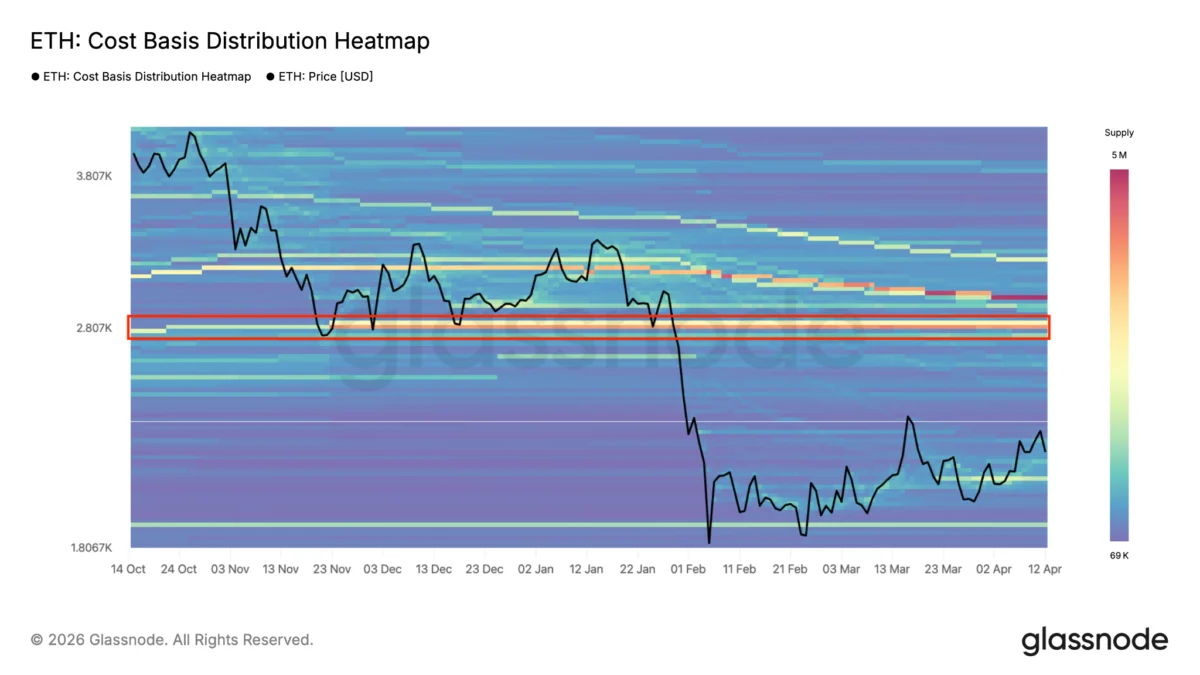
While the confluence of on-chain and technical indicators paints an overwhelmingly bullish picture, it is crucial to acknowledge potential resistance levels that could impede Ether’s ascent. Market analysis, particularly concerning cost basis distribution, highlights a significant concentration of investors who bought ETH at higher prices, creating a potential selling wall as the price approaches their breakeven points.
Glassnode’s cost basis distribution data reveals that approximately 7.6 million ETH are held by investors at an average cost basis ranging between $2,750 and $2,850. This concentration forms a formidable potential resistance zone. As Ether’s price approaches this range, many of these investors, who have been holding through a period of unrealized losses, may opt to sell their holdings to recover their initial investment or minimize further risk. Such a wave of selling pressure could potentially stall Ether’s upward momentum, necessitating significant buying volume to overcome. The Ethereum cost basis distribution chart visually represents this dense cluster of holdings at higher price points.
Adding to this cautious outlook, analyst TagadoBTC shared his perspective in a recent X post, stating, "Ethereum is heading, in my opinion, toward its next major resistance at $2,800." He further emphasized the critical importance of maintaining current support levels: "The $2,000 zone remains the one to hold, otherwise we risk falling back to the bottom of the channel." This underscores that while the path to $3,000 appears plausible, it is not without challenges, and a breach of crucial support could quickly reverse the recent gains. The ETH/USD daily chart shared by TagadoBTC provides a visual representation of these key resistance and support levels.

As previously reported by Cointelegraph, Ether’s potential for a sustained rally will significantly improve once the altcoin definitively breaks above the $2,400 resistance level. Should this key threshold be surpassed with conviction, the ETH/USDT pair could indeed surge towards the $2,800 mark, with the ultimate target of $3,000 becoming increasingly within reach.
Broader Market Context and Future Implications
Ethereum’s recent performance is not isolated; it reflects a broader shift in sentiment across the cryptocurrency market, often influenced by Bitcoin’s movements and wider macroeconomic trends. The de-escalation of geopolitical tensions, as indicated by the US-Iran ceasefire, typically reduces risk aversion among investors, making them more willing to allocate capital to volatile assets like cryptocurrencies. This general improvement in market conditions provides a conducive environment for altcoins like Ether to flourish.
Looking ahead, several factors could continue to influence Ethereum’s trajectory. Beyond the immediate market dynamics, ongoing developments within the Ethereum ecosystem itself, such as future network upgrades, continued growth in decentralized finance (DeFi) and non-fungible tokens (NFTs), and increasing institutional adoption, are fundamental drivers of its long-term value. Regulatory clarity, particularly concerning potential spot ETH ETFs in various jurisdictions, could also unlock significant institutional capital, providing further tailwinds for price appreciation.

The current confluence of positive indicators—whale profitability, aggressive accumulation, and favorable technical chart patterns—presents a compelling case for Ether’s continued upward momentum. However, the presence of strong resistance zones between $2,750 and $2,850, coupled with the critical need to hold the $2,000 support, suggests that the path to $3,000 will likely involve periods of consolidation and potential volatility. Investors will be closely watching for a decisive break above $2,400 as the next major confirmation of a sustained bullish trend. The market remains in a state of cautious optimism, balancing the strong signals of recovery with the inherent risks of a volatile asset class.