
The cryptocurrency market has recently observed a notable shift in Bitcoin (BTC) futures data, indicating a substantial deleveraging phase accompanied by a growing short bias among traders. This dynamic, unfolding as Bitcoin consolidates above the $70,000 mark, suggests that speculative positions, particularly those initiated with high leverage above this threshold over the past weekend, could face imminent liquidation. Concurrently, a suite of long-term Bitcoin valuation metrics has plummeted to historical lows, leading analysts to posit that the asset’s potential downside has largely been exhausted, with approximately 90% of the correction already factored into its current price.
A Period of Intense Speculation and Subsequent Deleveraging
The period leading up to these market adjustments was characterized by heightened bullish sentiment, propelling Bitcoin past significant resistance levels, including its all-time high. This ascent was fueled, in part, by the influx of capital from newly approved spot Bitcoin Exchange-Traded Funds (ETFs) in the United States, which brought institutional liquidity and retail enthusiasm to the forefront. As Bitcoin prices surged, reaching and briefly surpassing $73,000, the futures market witnessed a corresponding surge in open interest, reflecting increased leveraged bets on continued upward momentum.
However, the rapid expansion of leverage often precedes periods of correction or consolidation, as the market naturally seeks to rebalance itself. This pattern has become evident in recent days. On March 31, the weekly change in aggregate Bitcoin futures open interest (OI), a measure of the total number of outstanding derivatives contracts that have not been settled, peaked at an 8.9% increase. This indicated a substantial accumulation of leveraged positions, predominantly on the long side, as traders anticipated further price appreciation beyond the $73,000 level.
Chronology of the Leverage Reset

The subsequent week, however, marked a pivotal shift. By April 4, the weekly change in Bitcoin futures open interest dramatically flipped into negative territory, registering a contraction of -7.2%. This represented the sharpest deleveraging event in the observed period, signaling a rapid unwinding of speculative positions. The trend continued, with the seven-day change settling at -2.46% by Monday, bringing the total open interest to approximately 318,000 BTC. This significant reduction in leverage, as highlighted by Bitcoin researcher Axel Adler Jr., indicates a broad market reset rather than a cascading liquidation event that would typically trigger a sharp price decline.
Crucially, the fact that Bitcoin’s price managed to hold firm above $70,000 during this extensive deleveraging phase is a testament to the underlying strength of demand. In many historical instances, a rapid contraction in open interest of this magnitude would be accompanied by a significant price drop, as forced liquidations create selling pressure. The absence of such a dramatic collapse suggests that a substantial portion of the long-side leverage was closed voluntarily or absorbed by buyers without triggering a widespread panic sell-off. This resilience implies a healthier market structure emerging from the flush, with fewer over-leveraged participants vulnerable to sudden price swings.
Funding Rates Signal a Growing Short Bias and Potential for a Short Squeeze
Adding another layer of insight into the evolving market dynamics is the behavior of funding rates across major derivatives exchanges. Funding rates are periodic payments exchanged between long and short positions in perpetual futures contracts to keep the contract price pegged to the underlying asset’s spot price. A positive funding rate indicates that long position holders are paying short position holders, suggesting bullish sentiment, while a negative funding rate means short position holders are paying longs, indicating bearish sentiment.
The seven-day average funding rate across prominent platforms like Binance, Bybit, and OKX provides a clear illustration of this shift. From a positive 0.33% on March 31, the average funding rate sharply dropped to -0.1738% by April 13. This dramatic reversal into negative territory, particularly the even deeper negative values observed on Bybit and OKX, signals a pronounced shift towards a short-side bias in the futures market. Essentially, sellers are now paying buyers to maintain their short positions, reflecting an expectation among a growing segment of traders that Bitcoin’s price will decline.
This development creates a fascinating and potentially volatile scenario. While the initial deleveraging phase largely saw leveraged long positions being closed, the subsequent drop in funding rates suggests that new short positions have stepped in, betting against Bitcoin’s ability to sustain its price above $70,000. However, if Bitcoin’s price continues to hold steady or even shows signs of renewed upward momentum, these newly opened short positions could find themselves in a precarious situation. A sustained price above $70,000 in the face of negative funding rates could trigger a "short squeeze," where short sellers are forced to buy back Bitcoin to cover their positions, thereby driving the price even higher and creating a cascading effect. This mechanism often leads to rapid price appreciation, catching bearish traders off guard. The current market setup, therefore, presents a delicate balance, with the potential for either further consolidation or a sharp upward impulse driven by forced short covering.

Long-Term Valuation Metrics Point to Bitcoin Being Undervalued
Beyond the immediate dynamics of the derivatives market, a deeper analysis of Bitcoin’s long-term valuation metrics reveals a compelling narrative of potential undervaluation, despite its recent price highs. On-chain analysis, which examines data directly from the Bitcoin blockchain, offers insights into investor behavior, network health, and intrinsic value that are often overlooked by short-term price fluctuations. Michaël van de Poppe, founder of MN Capital, has highlighted three such critical indicators, all of which are currently signaling extreme lows, historically associated with significant market bottoms.
-
Puell Multiple Z-Score: This metric compares the daily issuance value of Bitcoin (miner revenue) to its 365-day moving average. A high Puell Multiple indicates that miners are realizing significant profits, often signaling market tops as miners sell to capitalize on high prices. Conversely, a low Puell Multiple suggests that miner profitability is relatively low compared to historical averages, indicating periods of stress or capitulation among miners. Currently, the Puell Multiple Z-Score is at its lowest reading in a decade, a level previously observed near the BTC price bottoms of 2018, 2020, and 2022. This suggests that the market may be nearing a phase where the selling pressure from miners has largely subsided, and the asset is fundamentally undervalued from a supply-side perspective.
-
Spent Output Profit Ratio (SOPR) Z-Score: The SOPR metric assesses whether coins are being sold at a profit or a loss. An SOPR value greater than 1 indicates that, on average, coins are being sold at a profit, while a value less than 1 suggests that coins are being sold at a loss. The SOPR Z-Score normalizes this metric, providing a statistical measure of its deviation from the mean. A historically low SOPR Z-Score, as is currently observed (reaching its lowest point on record), indicates widespread realization of losses across the market. This phenomenon is often seen during exhaustion phases of a market cycle, where short-term traders and weak hands capitulate, selling their holdings at a loss. Historically, such periods of widespread loss realization have coincided with market bottoms, preceding subsequent recoveries as stronger hands accumulate at lower prices.
-
Market-Value-to-Realized-Value (MVRV) Z-Score: The MVRV Z-Score is a powerful on-chain valuation tool that compares Bitcoin’s market capitalization (market value) to its realized capitalization (realized value), which represents the sum of all coin prices at the time they last moved on-chain. This metric essentially measures the aggregate cost basis of all Bitcoin in circulation. A high MVRV Z-Score indicates that the market value is significantly higher than the realized value, suggesting the asset is overvalued. Conversely, a low MVRV Z-Score implies that the market value is close to or even below the realized value, indicating undervaluation. The current MVRV Z-Score has printed its weakest reading ever, placing the BTC price near aggregate cost-basis zones. This suggests that a significant portion of investors are currently holding Bitcoin at or below their original purchase price, making it an attractive entry point for long-term investors.
Collectively, these three metrics paint a compelling picture: the market has undergone a significant reset, flushing out speculative excesses and bringing valuations down to levels historically associated with accumulation phases. The confluence of these indicators suggests that the euphoric buying that characterized earlier rallies has cooled, and the market is now dominated by holders with a longer-term outlook.

Implications for Bitcoin’s Price Trajectory and Market Health
The combined narrative emerging from the futures market deleveraging and the on-chain valuation metrics is one of a healthy, albeit potentially painful, market reset. The purging of excessive leverage is a crucial step in building a more sustainable rally, as it removes the fragility introduced by over-speculation. While the short-term price action might remain volatile, the reduction in open interest without a significant price crash indicates underlying demand strength.
The shift to negative funding rates, while signaling increased bearish sentiment in the short term, simultaneously creates the conditions for a potential short squeeze if demand for BTC returns or if positive news catalysts emerge. Traders who have recently opened short positions above $70,000 are now exposed to the risk of liquidation if Bitcoin manages to hold or regain higher ground.
Furthermore, the robust signals from the Puell Multiple, SOPR, and MVRV Z-Scores strongly suggest that Bitcoin is currently undervalued from a long-term perspective. These indicators have historically served as reliable guides for identifying major market bottoms, and their current readings imply that much of the potential downside has already been absorbed. Michaël van de Poppe’s assertion that "90% of the downside is already captured" resonates with the historical performance of these metrics.
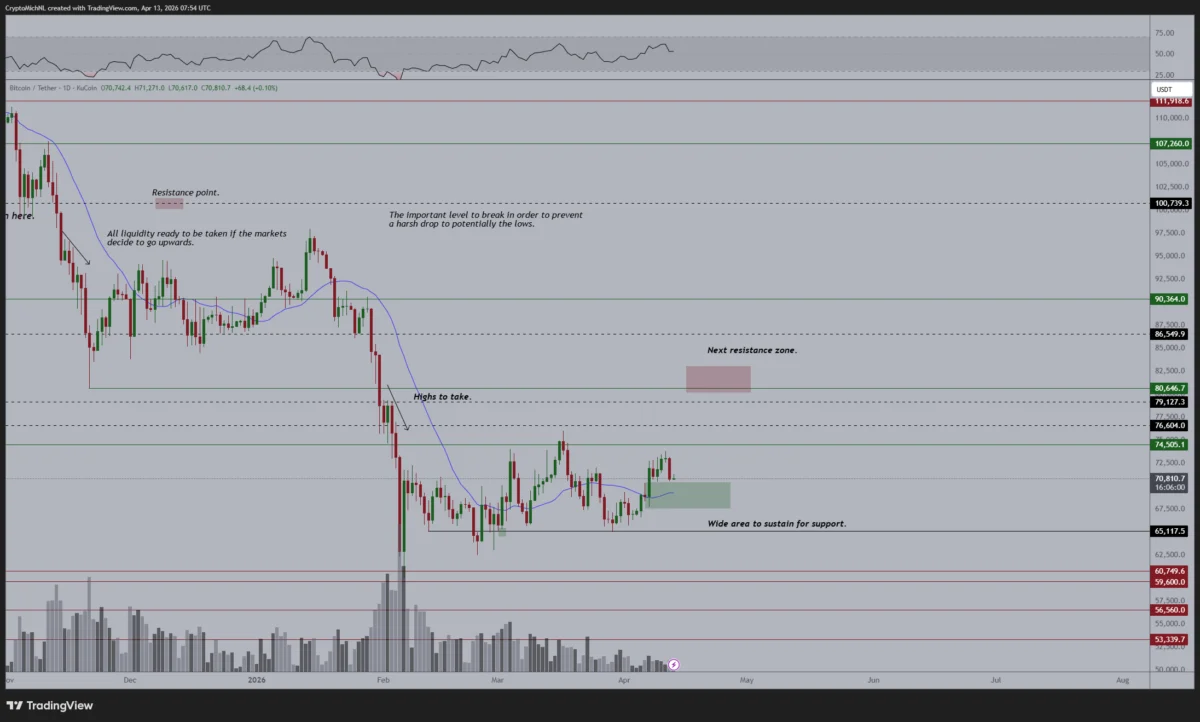
While visible liquidity exists between $64,000 and $66,000, which could serve as a temporary support zone if further price dips occur, the psychological and technical resistance at $74,000 remains a critical level for a sustained breakout. A decisive move above $74,000 would likely invalidate many of the recent short positions and could trigger a renewed bullish impulse.
This period of consolidation and re-evaluation is a natural and often necessary phase in any asset’s market cycle. It allows for the redistribution of assets from weaker, speculative hands to stronger, conviction-driven holders. For long-term investors, the current confluence of deleveraging and historical undervaluation metrics presents a compelling argument for accumulation, despite the immediate market uncertainties. The Bitcoin market appears to be recalibrating, preparing for its next significant move, with fundamental indicators suggesting that the path of least resistance, over the longer term, remains upward.