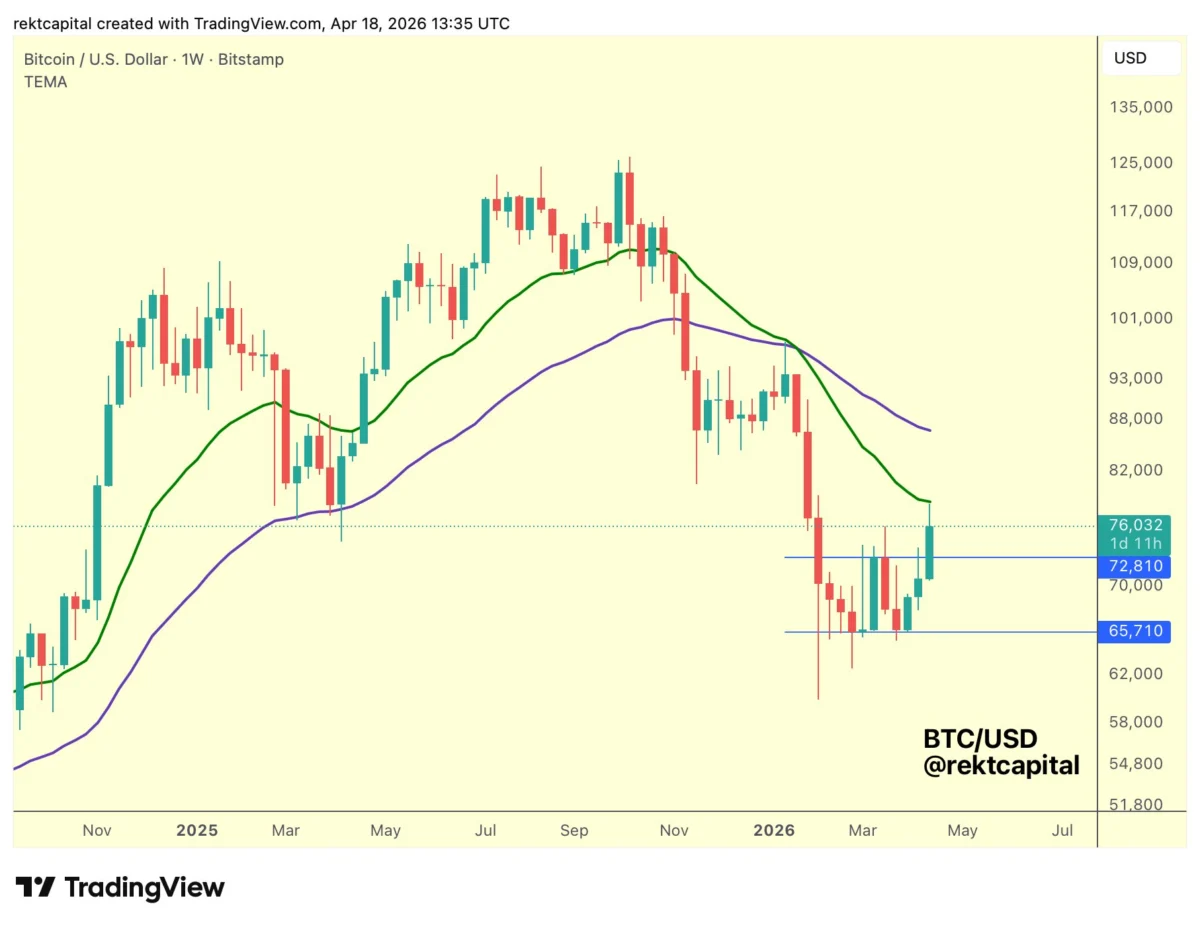
Bitcoin (BTC) has recently captured significant attention across financial markets, with its latest rally pushing prices to an impressive $76,000. This upward movement has been widely interpreted by market analysts as a "clear momentum shift," solidifying a short-term uptrend for the flagship cryptocurrency. The current market dynamics are being meticulously scrutinized by on-chain analysts and technical traders alike, revealing a complex interplay of supply-demand metrics, macroeconomic factors, and historical price patterns that suggest the rally may still have room to grow.
The Nuance of On-Chain Metrics: Short-Term Holder Profitability
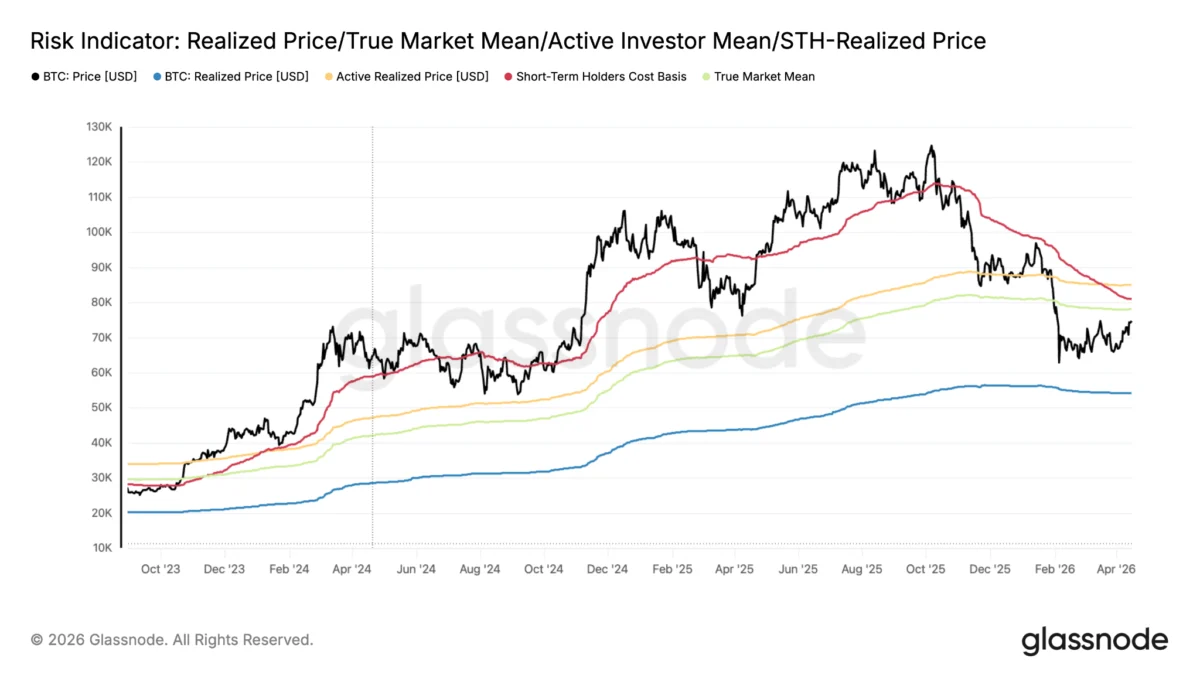
One of the most compelling indicators supporting the current bullish sentiment comes from Glassnode, a prominent on-chain analytics firm. Their data highlights the "Short-Term Holder (STH) supply in profit," a crucial metric that gauges the proportion of recently acquired Bitcoins currently held at an unrealized gain. This metric provides deep insights into the conviction and potential distribution patterns of market participants who have held their BTC for less than 155 days.
According to Glassnode’s latest "Week Onchain" newsletter, the STH supply in profit currently stands at 43.2%. Historically, local tops in bear market rallies have tended to form when this metric approaches its statistical mean of 54.2%. This threshold represents a critical juncture where the concentration of profitable short-term holders becomes sufficient to trigger meaningful selling pressure as these holders look to realize their gains. The fact that the current figure remains "meaningfully below that threshold" suggests that the present rally has not yet reached a typical zone of exhaustion. Glassnode explicitly stated, "This leaves slight room for further upside toward the True Market Mean, while also providing a quantitative level to monitor as price advances." This implies that a significant portion of short-term investors are still accumulating or holding, rather than distributing their holdings, which typically precedes a price correction.

Understanding the behavior of short-term holders is paramount in crypto markets. These participants are often more susceptible to market volatility and sentiment swings, making their profit-taking tendencies a key indicator of potential price ceilings. When the STH supply in profit dips, it can signal capitulation or a lack of conviction, whereas a rise, especially below the exhaustion threshold, can indicate growing confidence and accumulation. The current reading, therefore, lends weight to the argument that the market has not yet experienced the kind of widespread profit-taking event that would signal an imminent reversal, hinting at sustained upward momentum.
Technical Analysis and Mean Reversion: A Deeper Dive
Beyond on-chain metrics, traditional technical analysis also paints a nuanced but generally optimistic picture. Analyst McKenna, a respected voice in the crypto community, recently pointed out on X (formerly Twitter) that Bitcoin remains in "deep under extension territory" relative to its 50-week simple moving average (SMA). The 50-week SMA, a widely followed long-term trend indicator, currently sits at $96,800.
The concept of "under extension" implies that the current price is significantly below its long-term average, suggesting that the market has deviated considerably from its historical mean. Financial markets are inherently cyclical, and a fundamental principle known as "mean reversion" often dictates that assets, after significant deviations, tend to revert back to their averages over time. For Bitcoin to be "deeply under extended" relative to its 50-week SMA, it suggests a strong gravitational pull back towards that higher price point.
McKenna further elaborated on this dynamic, stating, "When markets deviate either to the upside or downside, they usually revert back to their mean." Combined with "clear momentum shifts and bullish trending signals firing then I would be inclined to be directionally bullish here." The analyst set a critical trigger point for increased confidence: "BTC breaking above $74K and holding this level on a HTF [high timeframe] is the final trigger I want to see to be confident in mid to high 80s over the coming weeks." This indicates a belief that a sustained breach of the $74,000 resistance level could unlock further upside, potentially pushing Bitcoin into the $80,000 to $90,000 range. The 50-week SMA acts as a significant psychological and technical level, and a move towards it would represent a substantial recovery from the recent market downturn.

Macroeconomic Tailwinds: The DXY Effect
The broader macroeconomic environment is also playing a pivotal role in Bitcoin’s recent performance. Fellow analyst Bitcoin Archive highlighted the falling US Dollar Index (DXY) as a "massive tailwind for the next leg up" for Bitcoin. The DXY measures the value of the U.S. dollar relative to a basket of major foreign currencies.
Historically, there has been an inverse correlation between the DXY and risk assets, including cryptocurrencies and commodities. When the dollar weakens, it often makes dollar-denominated assets, like Bitcoin, more attractive to international investors, as their purchasing power in local currencies increases. Furthermore, a declining DXY can signal a broader shift in investor sentiment away from safe-haven assets (like the dollar) towards riskier, growth-oriented investments. This often occurs during periods of perceived global economic stability or when central banks signal a more accommodative monetary policy, potentially leading to lower interest rates. A weaker dollar environment typically encourages investors to seek higher returns in alternative assets, thus providing a favorable backdrop for Bitcoin’s appreciation. The current trajectory of the DXY, therefore, adds another layer of fundamental support to the bullish narrative for Bitcoin.
Chronology of a Resurgence: Bitcoin’s Recent Price Trajectory
To fully appreciate the significance of the $76,000 rally, it’s crucial to understand Bitcoin’s journey over the preceding months. The cryptocurrency had previously reached an all-time high (ATH) of $126,000, only to experience a substantial 41% drawdown. This significant correction brought the BTC/USD pair below several key pricing levels, including the active realized price at $85,100, the STH cost basis at $80,950, and the true market mean, which currently stands at $78,140.

Following this downturn, Bitcoin entered a period of consolidation and recovery. A notable period of resurgence occurred between October 2024 and January 2025, which saw prices establish a robust foundation and begin an upward trajectory. This rally demonstrated Bitcoin’s resilience and its capacity for swift recovery after periods of significant depreciation. However, even with this recovery, Bitcoin faced considerable resistance in breaking out of certain price ranges.
The recent push to $76,000 signifies a renewed assault on these critical resistance levels. The ability to surpass psychological barriers and establish new short-term highs indicates a strengthening buyer conviction and a potential shift in market control from sellers to buyers. This momentum is further bolstered by increasing network activity and a strengthening technical setup, as previously reported by Cointelegraph, which often precede significant price movements. The journey from its $126,000 ATH to the current $76,000 reflects a market in flux, oscillating between periods of aggressive accumulation, distribution, and gradual recovery, with the latest move suggesting a decisive turn towards recovery.
Key On-Chain Price Levels and Resistance/Support Zones
Glassnode’s on-chain analysis provides specific price levels that are crucial for monitoring Bitcoin’s short-to-mid-term trajectory. At $74,000, Bitcoin is approximately 5.2% below the true market mean, a sophisticated metric that tracks the cost basis of the active BTC supply. This "true market mean" at $78,140 represents a significant psychological and technical hurdle. Glassnode noted that while the price has yet to "test and stabilize above this key threshold, the probability of a spike toward and potentially above it remains considerable in the mid-term."
The importance of the $78,000 level is further reinforced by cost basis distribution data. A heatmap visualizing investor acquisition prices reveals that over 200,000 BTC were acquired around the $78,000 mark. This concentration of supply indicates that many investors who bought at or around this price would likely break even or incur minimal losses if Bitcoin retests this level. Such a scenario often leads to increased selling pressure as these holders exit their positions, turning $78,000 into a strong resistance zone that the bulls will need to decisively overcome.

On the downside, critical support levels are also clearly identifiable. The first major support area is located at $72,000. This level is significant for several reasons: it’s where the 20-day and 50-day exponential moving averages (EMAs) appear to converge, indicating a strong technical confluence. EMAs give more weight to recent prices, making them highly responsive to current market trends. Their convergence often signals a strong support base where buying interest is likely to intensify. Furthermore, approximately 220,000 BTC were acquired by investors at or around the $72,000 price point, suggesting a substantial demand zone that could absorb selling pressure.
Below this, the $65,000-$70,000 price band emerges as a highly critical demand zone. This area has historically served as a vital support level, notably acting as a launching pad for the robust October 2024-January 2025 rally. The sheer volume of Bitcoin acquired in this range reinforces its strength as a historical accumulation zone. A sustained drop below the $70,000 mark would be a concerning development for bullish sentiment, potentially signaling that bears are regaining control and increasing the prospects of a further decline toward the $60,000 level. These on-chain and technical levels provide a detailed roadmap for investors and traders to navigate the evolving market landscape.
Market Sentiment and Broader Implications
The current rally and the supporting on-chain and technical data contribute to a cautiously optimistic market sentiment. While the immediate focus is on Bitcoin’s price action, its movements inevitably ripple across the broader cryptocurrency ecosystem. A sustained Bitcoin rally often acts as a catalyst for altcoins, leading to a general uptrend in the market as capital flows from Bitcoin into other digital assets. This phenomenon, often referred to as "altcoin season," could be a potential implication if Bitcoin maintains its upward momentum.
For retail investors, the rally rekindles enthusiasm and confidence, potentially drawing new capital into the market. For institutional investors, a sustained move above key technical and on-chain levels could validate their long-term investment theses, potentially leading to increased institutional adoption and larger capital allocations. The fact that the STH supply in profit is not yet at exhaustion levels suggests that the market isn’t overheated with short-term speculative fervor, offering a more sustainable growth narrative.

However, the cryptocurrency market remains inherently volatile. While the current indicators are largely positive, factors such as global macroeconomic shifts, regulatory developments, and unforeseen market events can rapidly alter sentiment. The reference to the $126,000 all-time high serves as a reminder of Bitcoin’s potential for both significant gains and substantial drawdowns. Investors are encouraged to remain vigilant, conduct thorough due diligence, and understand the inherent risks associated with digital asset investments.
Looking Ahead: Pathways and Potential Obstacles
As Bitcoin navigates this pivotal phase, several pathways lie ahead. Should the bullish momentum continue, a decisive break and stabilization above the true market mean of $78,140, and subsequently the psychological barrier of $80,000, would strongly confirm a more robust uptrend. This could pave the way for a retest of the 50-week SMA at $96,800, potentially even targeting a return to triple-digit thousands. The falling DXY provides a macroeconomic tailwind, while the STH supply in profit metric suggests that the market has not yet reached its typical exhaustion point.
Conversely, a failure to hold above the critical $74,000 level, or a retreat below the immediate support at $72,000, could signal a period of consolidation or a minor correction. A more significant downturn, marked by a break below the crucial $65,000-$70,000 demand zone, would necessitate a reassessment of the short-term bullish outlook and could open the door for a retest of lower support levels, including $60,000.
The confluence of on-chain data, technical analysis, and macroeconomic indicators paints a complex yet predominantly optimistic picture for Bitcoin in the near to medium term. The current rally to $76,000 is not merely a price spike but appears to be underpinned by fundamental shifts in market structure and investor behavior. As such, monitoring the key resistance and support levels, particularly the STH supply in profit and the true market mean, will be paramount for investors seeking to understand Bitcoin’s ongoing evolution in the global financial landscape. The journey ahead for Bitcoin promises to be dynamic, with potential for significant movements as it tests these crucial thresholds.