
 Clara Shinta
Glassnode Pinpoints Critical Overhead Liquidity Structures
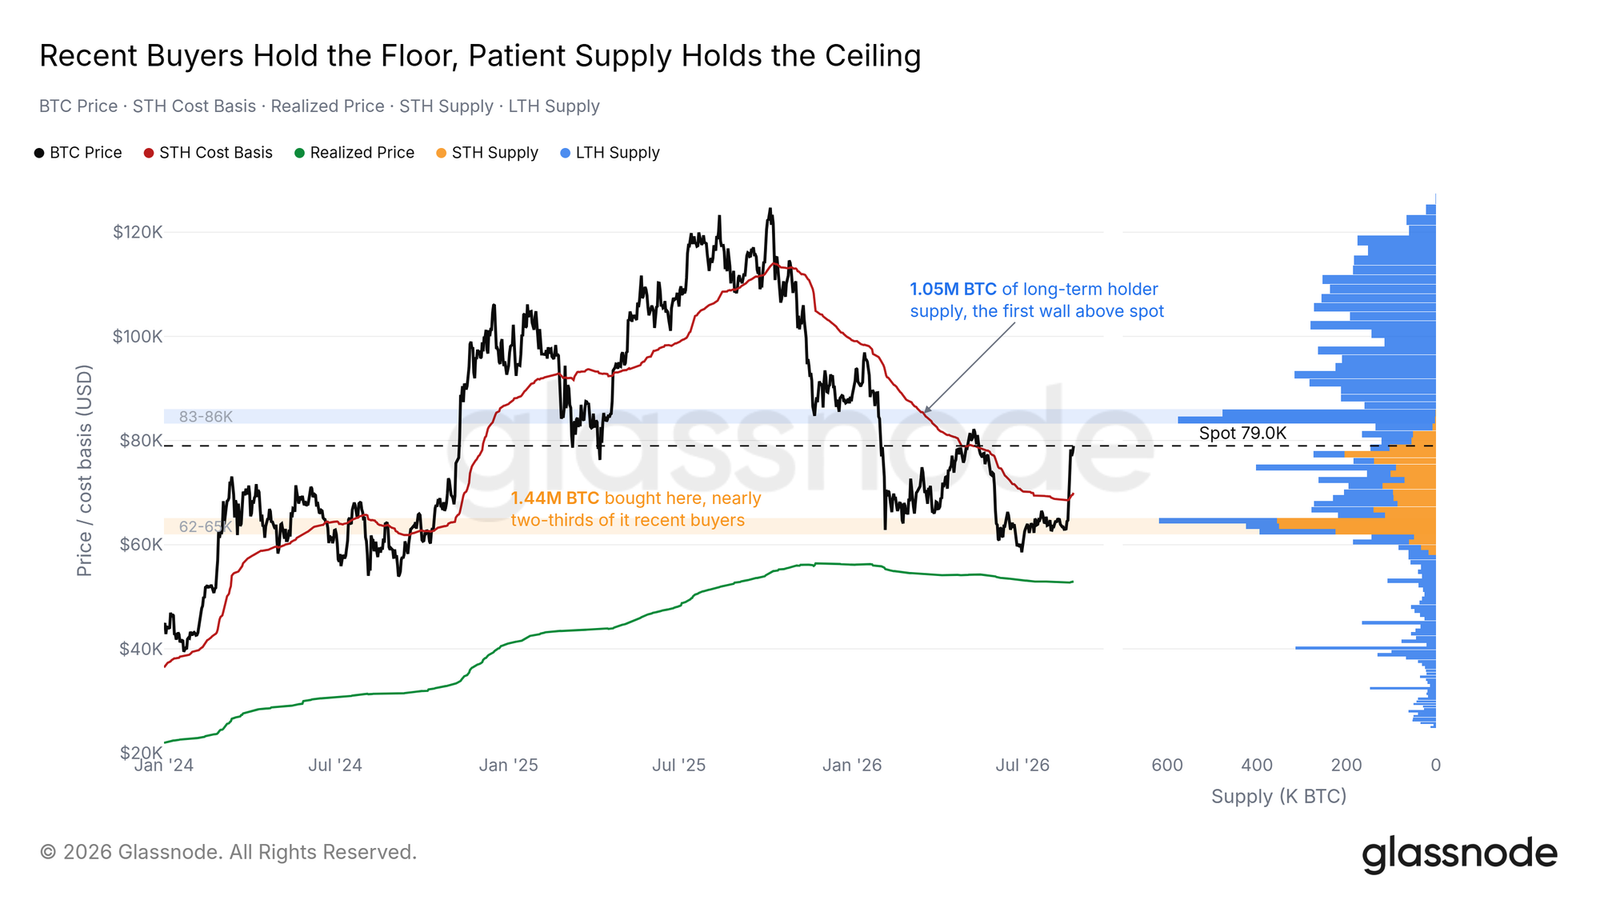
In its latest edition of the widely followed newsletter, "The Week Onchain," crypto analytics platform Glassnode unveiled crucial insights into Bitcoin’s market structure. The report highlighted the presence of multiple substantial pools of Bitcoin supply that could potentially enter the market should the price ascend into the $81,000 to $86,000 range. This "overhead liquidity" represents a significant selling pressure that could impede further upward movement, acting as a natural ceiling for price appreciation in the near term.
Of particular interest within this identified zone are the holdings of Long-Term Holders (LTHs). LTHs are defined as wallets that have held their Bitcoin without selling for at least six months, often representing conviction investors who have weathered previous market downturns. Glassnode’s analysis points to a substantial portion of this "patient supply" residing within the $83,000-$86,000 band. The report explicitly stated, "Above, the first heavy structure is $83K-86K, and effectively all of it is long-term holder supply that has sat through the entire drawdown." This observation carries significant weight, as it suggests that reaching the $83,000 threshold could trigger a pivotal moment for this cohort. Many LTHs who accumulated Bitcoin at higher prices before previous market corrections might find themselves at or near their breakeven point if the price reaches this level. The temptation to sell and recoup losses, or simply de-risk after a prolonged holding period, could introduce substantial selling pressure, testing their resolve to maintain their positions. This dynamic underscores the psychological battleground that this price range represents, where long-held convictions will be put to the ultimate test.
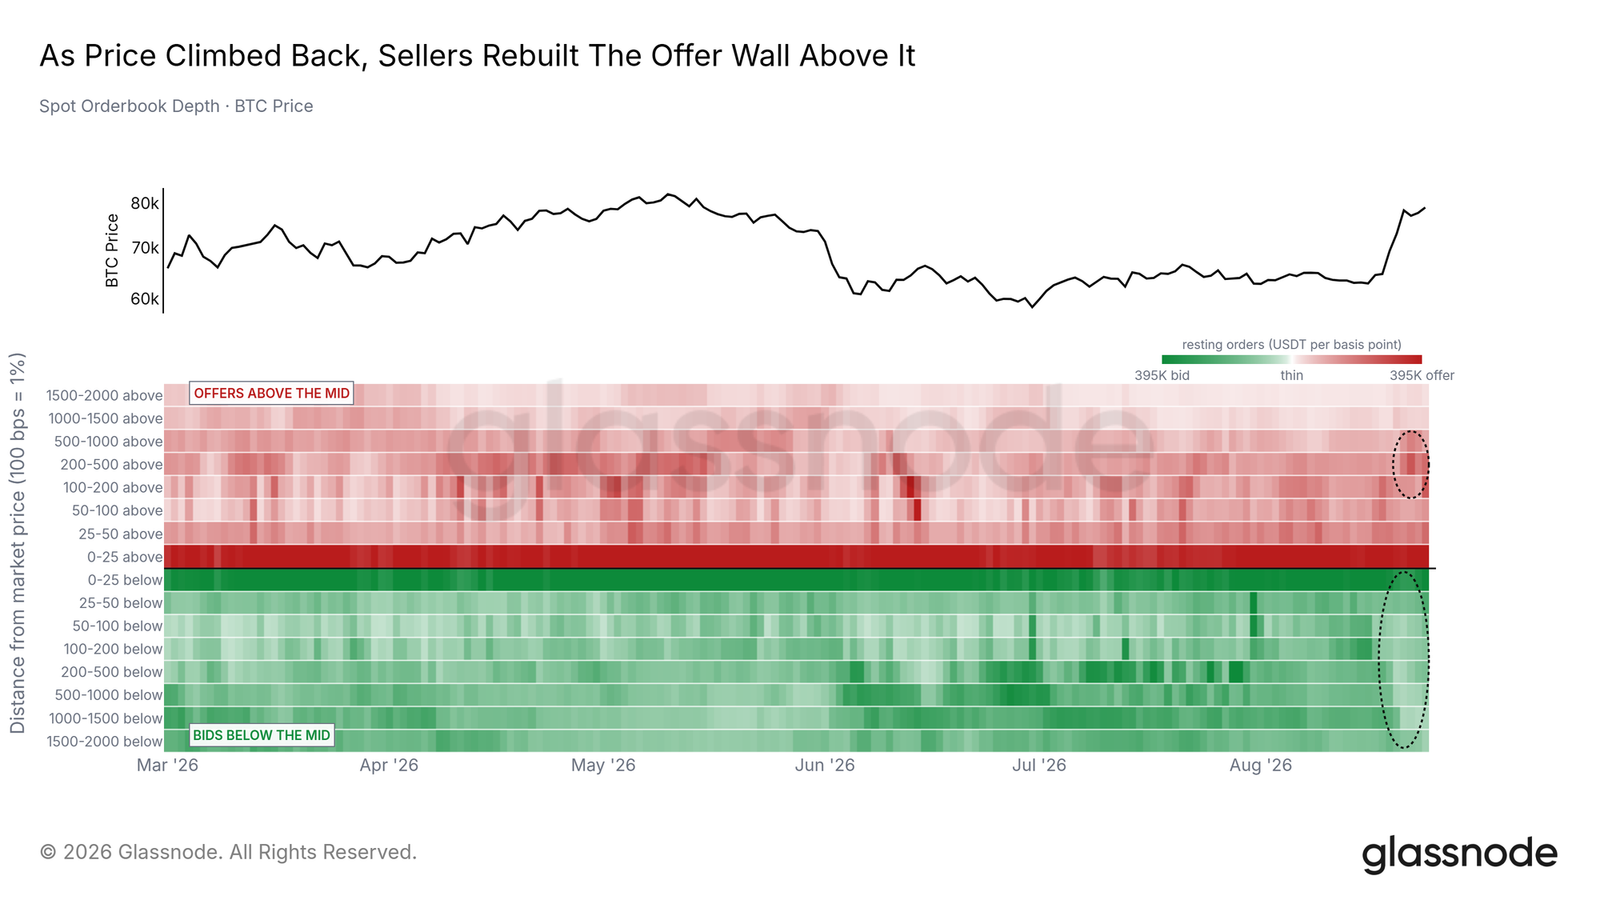
Furthermore, Glassnode’s research noted the emergence of new "ask liquidity" on exchange order books within this same critical zone. Ask liquidity refers to limit sell orders placed by traders at specific prices. While some of these orders might represent genuine intentions to sell, Glassnode suggests that some owners of these orders may not necessarily intend for them to be filled immediately. Instead, these "laddered asks" could be strategically placed to attempt to keep the spot price suppressed, or to benefit from potential upward movements by adjusting their positions if the price does rise further. This tactical placement of sell orders contributes to the overall supply wall, reinforcing the resistance encountered by Bitcoin’s upward trajectory. The confluence of these factors – the potential release of LTH supply and strategic ask liquidity – paints a clear picture of a formidable barrier that demand must overcome.
A Confluence of Technical Indicators Reinforces Resistance
Beyond the on-chain analysis, a deeper dive into technical indicators reveals a powerful convergence of multiple resistance levels within the $81,000 to $86,000 corridor, solidifying its status as a pivotal battleground for Bitcoin. Glassnode’s comprehensive report intricately detailed these layers of resistance, stating, "The re-laddered asks join a stack of independent structure pointing at one zone. The first self-custody cost-basis shelf begins at $80.8K, dealer gamma flips negative at $82.3K, the surviving liquidation shelf runs to $86K, and the patient-supply wall fills $83K-86K."

Let’s break down these critical technical elements:
- Self-Custody Cost-Basis Shelf at $80.8K: This refers to the average acquisition price of Bitcoin held in self-custody wallets. When the price approaches this level, many holders might find themselves at breakeven or in a modest profit, potentially leading to increased selling activity as they realize gains or reduce exposure. This forms a foundational layer of resistance just above the current trading range.
- Dealer Gamma Flips Negative at $82.3K: In options markets, "gamma" measures the rate of change of an option’s delta. A flip to negative gamma for dealers (market makers) often implies that as the underlying asset (Bitcoin) rises, dealers need to sell more of the asset to hedge their positions. This dynamic can create increased selling pressure, acting as a significant headwind to price appreciation. This technical threshold indicates a point where market mechanics could actively work against further bullish movement.
- Surviving Liquidation Shelf to $86K: This refers to clusters of leveraged long positions that would be forcibly closed, or "liquidated," if Bitcoin’s price were to drop significantly. Conversely, the "surviving" aspect implies that once the price rises to a certain point, these positions become profitable and could be closed out for profit, contributing to selling pressure. The presence of a liquidation shelf up to $86K indicates that a significant amount of capital is positioned such that reaching this level could trigger profit-taking or the closure of precarious positions, creating a supply overhang.
- Patient-Supply Wall at $83K-$86K: As previously discussed, this refers to the substantial holdings of Long-Term Holders (LTHs) whose average cost basis falls within this range. Their potential decision to sell at breakeven or a modest profit after enduring a drawdown forms a formidable "wall" of supply.
Glassnode succinctly summarized the gravity of this convergence: "Every overhead structure we track now sits between $81K and $86K; that band is where the recovery’s demand meets its test." This statement underscores the unified nature of these technical and on-chain indicators, all pointing to a singular, critical resistance zone.
Trend Lines Converge on a Narrow Price Corridor
Adding another layer to this intricate web of resistance, multiple conventional price trend lines have also converged around the $80,000 area, further strengthening its role as a significant hurdle. These widely followed technical indicators provide additional validation for the intense supply pressure expected in the upper $80,000s.
According to data from TradingView, Bitcoin’s 50-week Exponential Moving Average (EMA) currently sits at approximately $77,353, while its 100-week EMA is positioned around $78,485. Moving averages are crucial tools for identifying trends and potential support/resistance levels. EMAs, in particular, give more weight to recent prices, making them more responsive to current market sentiment. The proximity of these two significant weekly EMAs to the $80,000 mark suggests that breaking above them, and sustaining that breakout, is essential for confirming a stronger bullish trend.
Furthermore, the 365-day Volume-Weighted Average Price (VWAP) for Bitcoin currently hovers around $82,600. The VWAP is a sophisticated moving average that factors in trading volume, giving more significance to price levels where more trading activity occurred. As such, it often acts as a robust indicator of fair value and can serve as a strong resistance or support level. The fact that the 365-day VWAP falls squarely within the $81,000-$86,000 critical zone identified by Glassnode reinforces the technical strength of this resistance band. The convergence of these long-term trend lines – the 50-week EMA, 100-week EMA, and the 365-day VWAP – creates a powerful technical ceiling that Bitcoin’s price must overcome to signify a sustained upward trajectory.
Market Context and Recent Performance: A Chronology of the Rally
Bitcoin’s journey to the cusp of $80,000 has been marked by a significant rally, particularly following the highly anticipated halving event earlier in the year. The halving, which reduced the supply of new Bitcoin entering the market by 50%, has historically been a catalyst for price appreciation in subsequent months. Following this event, coupled with growing institutional interest and the approval of spot Bitcoin Exchange-Traded Funds (ETFs) in major markets, Bitcoin experienced a robust upward trend, pushing past previous resistance levels and reaching new all-time highs.
The rally, however, has not been without its periods of consolidation and minor corrections. After reaching an initial peak, Bitcoin entered a phase of price discovery, characterized by heightened volatility. As it approached the $80,000 threshold, the pace of the ascent began to slow, indicating increased selling pressure and a reluctance among buyers to push the price significantly higher without stronger conviction. This slowdown around $80,000 set the stage for the current struggle, where the initial momentum appears to be meeting a formidable wall of supply and technical resistance.
The broader macroeconomic environment also plays a crucial role in shaping investor sentiment. Concerns over persistent inflation, potential interest rate hikes by central banks, and geopolitical uncertainties have created a cautious atmosphere in global financial markets. While Bitcoin is often seen as a hedge against inflation, its price action can still be influenced by overall risk appetite. When traditional markets show signs of weakness or uncertainty, investors may opt for safer assets or reduce exposure to more volatile ones like cryptocurrencies, adding another layer of complexity to Bitcoin’s price dynamics. The current hesitation around $80,000 could partly reflect this broader market caution, as investors weigh the risks and rewards of pushing Bitcoin into uncharted territory.
Investor Sentiment and Analyst Perspectives on Endurance
The rapid rebound in Bitcoin’s price from its recent lows has naturally been met with a degree of skepticism from market participants and analysts alike. While the bullish momentum has been undeniable, questions persist regarding the sustainability of the rally and whether the current demand is strong enough to overcome significant overhead supply.
Prominent trader and analyst Rekt Capital, known for his insights into cryptocurrency market cycles, has previously stressed the importance of Bitcoin needing to hold key moving averages, such as the 50-week EMA, for an extended period before a meaningful trend change can be definitively declared. His perspective aligns with the current technical analysis, suggesting that simply touching or briefly surpassing these levels is insufficient; a sustained hold is crucial for building a strong foundation for future growth. The current struggle around the 50-week EMA ($77,353) and 100-week EMA ($78,485) directly speaks to this critical requirement.
Furthermore, some analysts have pointed to historical market cycle patterns, suggesting that "bear market timing [is] due to continue until the end of 2026." While this might seem contradictory to the recent bullish price action, it often refers to broader, multi-year cycles that encompass periods of consolidation and re-accumulation, even within an overarching long-term bullish trend. This perspective suggests that while short-term rallies can be strong, the market may still be within a larger phase that demands patience and sustained fundamental strength before entering a full-fledged, unchecked bull run reminiscent of previous peaks. This long-term outlook serves as a reminder that market dynamics are complex, and even powerful rallies can face significant hurdles that require time and strong fundamentals to overcome.
Implications and Future Outlook
The coming weeks will be pivotal for Bitcoin’s short-to-medium term trajectory, as the market confronts the formidable resistance band between $81,000 and $86,000. The implications of Bitcoin’s performance in this zone are far-reaching for investors, traders, and the broader cryptocurrency ecosystem.
If the Resistance Holds: Should the combined weight of LTH supply, new ask liquidity, and converging technical indicators prove too strong, Bitcoin could face a period of consolidation or even a retracement. A failure to decisively break above $86,000 might lead to a retesting of lower support levels, potentially including the $70,000 mark or even lower. Such a scenario would likely trigger profit-taking among short-term traders and could cool down overall market enthusiasm. Investors might then look for clearer signs of renewed demand or a shift in macroeconomic conditions before committing further capital. This could lead to an extended period of sideways trading as the market digests the recent gains and attempts to build a more stable foundation.
If the Resistance Breaks: Conversely, a decisive breakthrough of the $81,000-$86,000 resistance band would be a powerful bullish signal. It would indicate that demand is strong enough to absorb the substantial overhead supply and overcome significant technical barriers. Such an event could ignite renewed investor confidence, potentially paving the way for Bitcoin to target new all-time highs. A successful breach would invalidate many of the bearish technical structures and psychological resistance points, creating a clearer path for further upward movement. This would likely attract fresh capital from both retail and institutional investors, fueling the next leg of the rally.
The nature of the demand required to overcome this supply wall is crucial. A sustained push through this zone would likely necessitate significant institutional buying pressure, possibly from spot Bitcoin ETFs, coupled with renewed retail interest. This would indicate a broader market conviction in Bitcoin’s value proposition and its long-term growth potential.
However, irrespective of the outcome, Bitcoin’s inherent volatility remains a defining characteristic. Investors are encouraged to conduct thorough independent research and consider the inherent risks associated with cryptocurrency investments. The current situation highlights the intricate interplay of on-chain analytics, technical indicators, market psychology, and macroeconomic factors that collectively influence Bitcoin’s price action. The battle for $80,000, and more critically, the $81,000-$86,000 corridor, will serve as a crucial barometer for the market’s strength and direction in the coming months.