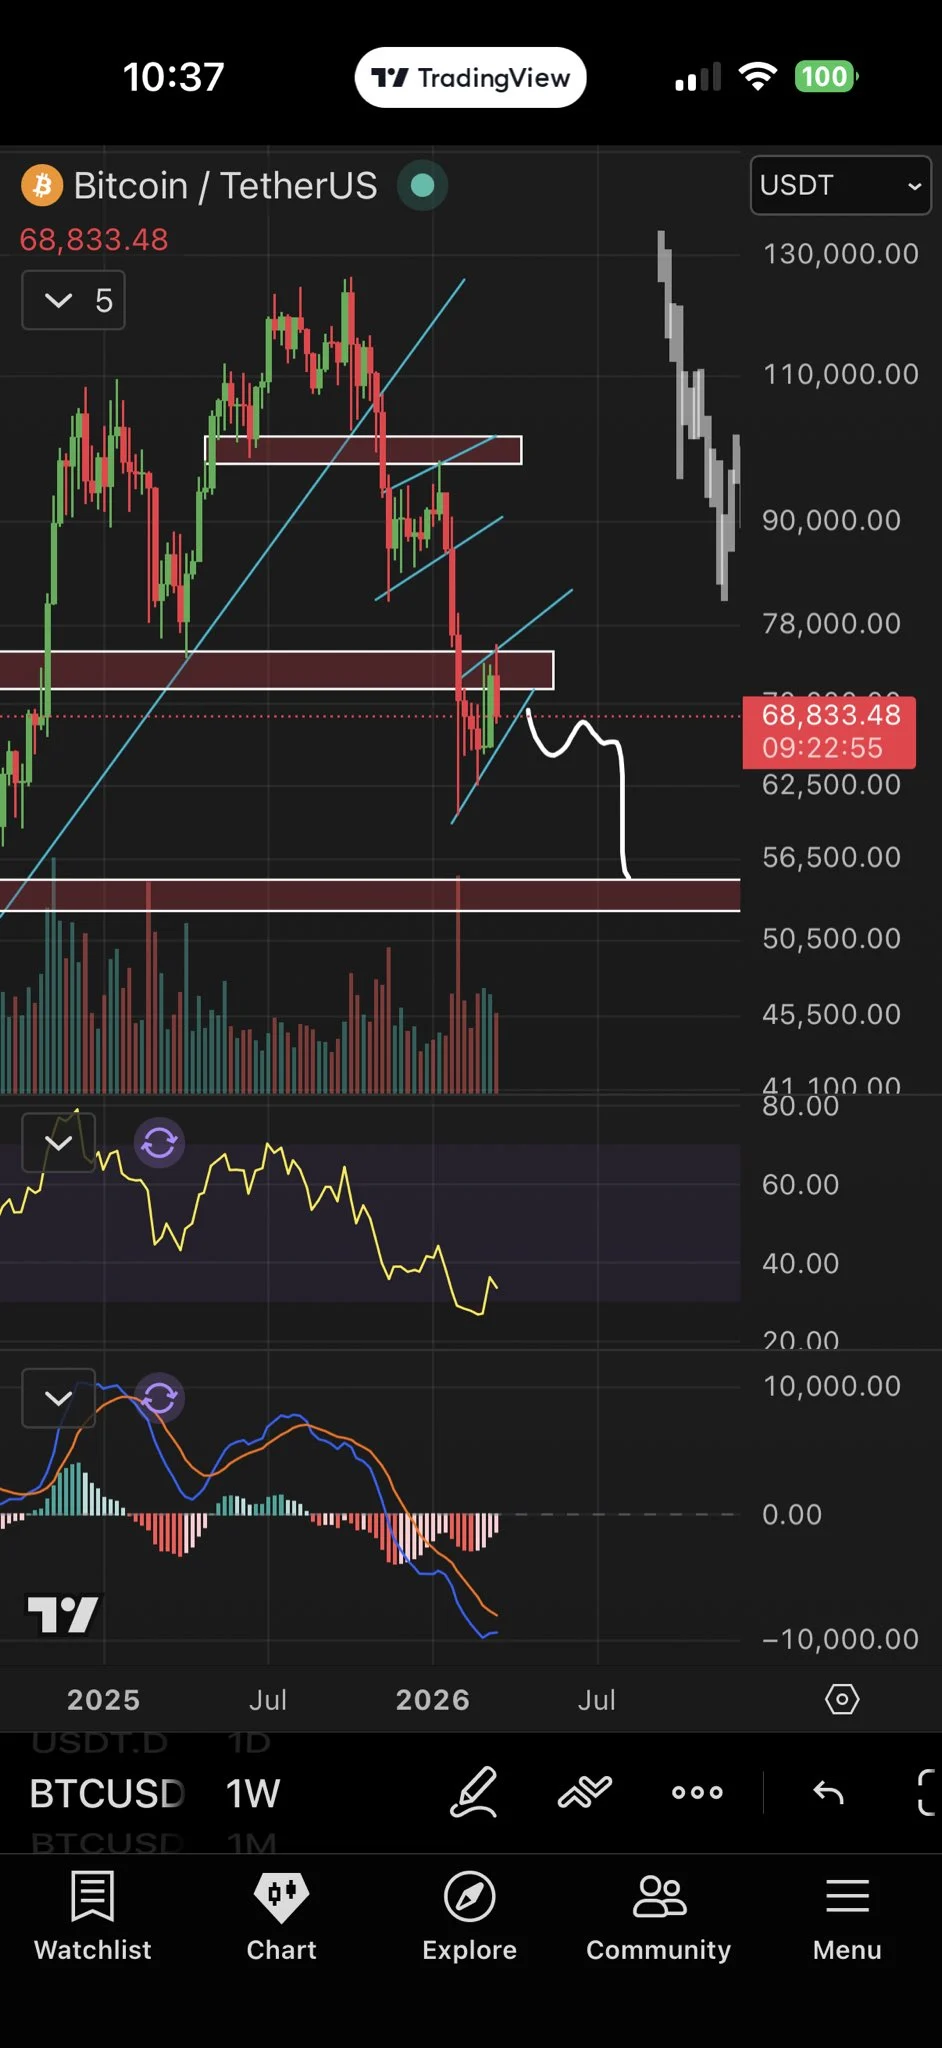
Bitcoin (BTC) experienced significant price pressure, trading below the pivotal $69,000 mark on Sunday as the cryptocurrency market braced for a critical weekly candle close. The weekend saw bearish momentum take hold, leading to a notable dip that tested key support levels and fueled discussions among analysts regarding Bitcoin’s immediate future trajectory. This price action unfolded against a backdrop of increasing market complexity, where traditional technical indicators are showing conflicting signals, and broader macroeconomic factors continue to exert influence.
The latest downturn saw BTC price action circling a crucial trend line after a weekend dip brought it near the $68,000 level. This movement has placed the cryptocurrency at a significant crossroads, with market participants closely watching whether established support zones will hold or if further downside corrections are imminent. The psychological threshold of $69,000, which has previously acted as both resistance and support, remains a focal point for traders. Its breach indicates a weakening in short-term bullish sentiment and necessitates a re-evaluation of market structure.
Intensified Volatility and Significant Liquidations
The weekend’s bearish shift intensified into Saturday’s daily close, resulting in substantial liquidations across the cryptocurrency derivatives market. Data from CoinGlass revealed that over $300 million in long positions and nearly $100 million in short positions were liquidated within a 24-hour period leading up to the time of writing. This staggering sum, totaling over $400 million, underscores the heightened volatility and leverage prevalent in the market. Long liquidations occur when the price moves against bullish bets, forcing traders to close their positions, often exacerbating price declines. Conversely, short liquidations happen when the price unexpectedly rises, catching bearish traders off guard. The near-equal distribution, albeit with a heavier tilt towards longs, indicates a whipsaw market environment where both sides of the trade are experiencing significant pressure.

This liquidation cascade is a common feature of highly leveraged markets like cryptocurrency and often serves as a "reset" mechanism, clearing out excessive speculative positions. However, the magnitude of these liquidations within a short timeframe highlights the fragility of current market sentiment and the potential for rapid price swings. Such events often precede either a consolidation phase or a more decisive move in one direction as the market rebalances its risk exposure.
The Evolving Significance of Key Technical Support Levels
In the wake of this volatility, BTC/USD found itself re-engaging with its 200-week Exponential Moving Average (EMA), positioned near $68,300. The 200-week EMA is historically one of the most revered technical indicators in Bitcoin analysis, often signaling the line between bull and bear markets. In previous cycles, a strong hold above this EMA indicated robust bullish momentum, while a sustained break below it typically heralded prolonged bear markets.
However, as Cointelegraph previously reported, the 200-week EMA has demonstrated an "unreliable" nature in 2026, failing to consistently provide the expected support. This shift in its efficacy reflects the evolving dynamics of the Bitcoin market, which has matured significantly with the introduction of institutional players and regulated investment vehicles like spot Bitcoin Exchange-Traded Funds (ETFs). The traditional playbooks for Bitcoin analysis are being rewritten as new forces interact with established patterns.
Trader and analyst Rekt Capital emphasized the critical nature of the current interaction with the 200-week EMA. Last week, he posited that for the price to establish a solid foundation for upside continuation, it must retest this trend line as support from above. This implies a scenario where Bitcoin dips to or slightly below the EMA, finds buying pressure, and then bounces back, confirming the level as legitimate support.

However, Rekt Capital also presented a more cautious outlook, noting on X: "More, there’s also a chance that Bitcoin could simply meander in and around the 200-week EMA for a while, never really turning it into convincing resistance, never really turning it into convincing support, before ultimately breaking down into additional Macro Downside over time anyway." This perspective suggests a period of prolonged consolidation or indecision, where the market struggles to establish a clear directional bias around this crucial moving average. Such a scenario could lead to increased frustration among traders and potentially set the stage for a more significant breakdown if fundamental catalysts fail to emerge. The ambiguity surrounding the 200-week EMA’s role in the current market cycle adds another layer of complexity for investors attempting to forecast future price movements.
Persistent Bearish Sentiments and the $50,000 Target
Amidst the technical indecision, several analysts maintain a decidedly bearish stance. Trader Roman reiterated his conviction for a $50,000 target for Bitcoin, expressing skepticism about the current market’s ability to sustain upward momentum. He articulated his reasoning on X, stating: "There are still 0 signs of bear market exhaustion on HTF. No divs, no bear PA exhaustion, no momentum loss, etc," referring to higher time frames.
Roman’s analysis points to a lack of traditional signals that typically indicate a market bottom or a significant reversal of bearish trends. "HTF" (Higher Time Frames) refers to daily, weekly, or monthly charts, which provide a broader perspective on market trends and are generally considered more reliable than shorter time frames. "Divs" (Divergences) occur when price action and an oscillator (like the Relative Strength Index or MACD) move in opposite directions, often signaling a potential reversal. "Bear PA exhaustion" refers to a pattern where bearish price action becomes less intense, suggesting selling pressure is waning. The absence of these indicators, according to Roman, suggests that the market is not yet ready for a sustained recovery, bolstering his confidence in a downside target of $50,000 and potentially even lower. This strong conviction from a prominent analyst contributes to the prevailing cautious sentiment, particularly among those who prioritize macro technical analysis over short-term fluctuations.
A Glimmer of Hope: The Golden Cross Formation

Despite the overarching bearish warnings and the critical test of support, a potential silver lining emerged in the form of a "golden cross" involving two other significant moving averages. This technical pattern, often interpreted as a bullish signal, occurred as the 21-day simple moving average (SMA) crossed above its 50-day equivalent.
A golden cross is typically observed when a shorter-term moving average (e.g., 21-day SMA) crosses above a longer-term moving average (e.g., 50-day SMA). This crossover suggests that recent price momentum is strengthening relative to the longer-term trend, potentially indicating the start of an upward price trend. For many technical analysts, this pattern signals growing bullish sentiment and can act as a buy signal.
Commenting on this development, Keith Alan, co-founder of the trading resource Material Indicators, offered a cautiously optimistic assessment. In an X post, he acknowledged: "The Golden Cross will likely deliver some short term bullish momentum. Must watch to see if it develops into something durable." Alan’s statement highlights the conditional nature of this bullish signal, emphasizing that while it might provide a temporary boost, its long-term significance hinges on whether the momentum can be sustained and translate into a durable uptrend. He concluded by noting, "For now…the range game continues," underscoring the prevailing market condition of consolidation and indecision within a defined price range. This "range game" implies that while short-term movements might be influenced by indicators like the golden cross, the broader market is still awaiting a definitive catalyst to break out of its current trading pattern.
This recent golden cross stands in stark contrast to earlier technical signals observed in March, when the BTC/USD chart produced two "death crosses." A death cross is the inverse of a golden cross, occurring when a shorter-term moving average crosses below a longer-term one, traditionally signaling a bearish trend and often preceding significant downside pressure. These earlier death crosses had sparked warnings of a potential collapse below $40,000, illustrating the sharp swings in technical outlook that have characterized Bitcoin’s price action in recent months. The presence of both bullish and bearish crossover signals within a relatively short period underscores the highly contested nature of Bitcoin’s current market direction and the ongoing battle between buyers and sellers.
Broader Market Context and Driving Factors

Bitcoin’s recent price movements are not isolated events but are deeply intertwined with a confluence of macroeconomic factors and unique cryptocurrency market dynamics. The global economic landscape, characterized by fluctuating interest rates, persistent inflation concerns in major economies, and shifting central bank policies, continues to influence investor appetite for risk assets like Bitcoin. Higher interest rates typically make safer investments more attractive, potentially drawing capital away from volatile assets. Conversely, expectations of rate cuts can spur renewed interest in growth-oriented assets.
The impact of spot Bitcoin ETFs, approved in the United States earlier this year, remains a significant driver of price action. While these ETFs initially brought substantial institutional inflows, leading to Bitcoin’s rally to new all-time highs, subsequent periods have seen fluctuating flows. Net outflows from these ETFs can exert downward pressure on price, while strong inflows can provide support. Understanding the daily flow dynamics of these investment vehicles is crucial for assessing institutional sentiment and their role in price discovery.
Furthermore, the recent Bitcoin halving event, which occurred in April, has traditionally been a catalyst for price appreciation due to a reduction in new supply. However, the market’s reaction post-halving has sometimes involved a "lull" or consolidation phase before any significant upward movement. This period allows the market to digest the supply shock and for demand to catch up. The current price action could be interpreted as part of this post-halving consolidation, where the market seeks a new equilibrium.
Market sentiment indicators, such as the Crypto Fear & Greed Index, also provide valuable insights. During periods of extreme fear, the market may be oversold, potentially signaling a buying opportunity, while extreme greed can indicate an overheated market ripe for correction. Monitoring these sentiment shifts, alongside open interest in derivatives markets and funding rates, helps to gauge overall market leverage and participant confidence.
Implications and Forward Outlook

The current price action, particularly the critical weekly candle close below $69,000 and the retest of the 200-week EMA, holds significant implications for Bitcoin’s short-term and medium-term trajectory. A sustained break below these key support levels could confirm the bearish outlooks and potentially open the door for further downside, possibly towards Roman’s $50,000 target. Such a scenario would likely trigger additional liquidations and a broader market sell-off, impacting altcoins as well.
Conversely, a swift rebound above $69,000, especially if accompanied by strong buying volume, could invalidate the immediate bearish concerns and re-establish a more positive market sentiment. The golden cross, if it proves to be a durable signal, could provide the necessary short-term momentum for such a recovery. However, the market remains highly susceptible to sudden shifts, and conflicting technical signals suggest that a period of range-bound trading or heightened volatility may persist.
Investors and traders are advised to exercise caution and conduct thorough research. The confluence of macro-economic uncertainties, evolving technical patterns, and the ongoing integration of traditional finance into the crypto space makes the current environment particularly complex. The "range game" described by Keith Alan underscores the current state of indecision, where both significant upward and downward movements remain plausible depending on how key support and resistance levels are ultimately resolved. The coming days will be crucial in determining whether Bitcoin can reclaim its footing or if it is destined for a deeper correction.
This article does not contain investment advice or recommendations. Every investment and trading move involves risk, and readers should conduct their own research when making a decision. While we strive to provide accurate and timely information, Cointelegraph does not guarantee the accuracy, completeness, or reliability of any information in this article. This article may contain forward-looking statements that are subject to risks and uncertainties. Cointelegraph will not be liable for any loss or damage arising from your reliance on this information.