
Bitcoin’s recent surge to approximately $76,000 has undeniably reignited a wave of market optimism among investors, yet a comprehensive analysis of on-chain data and broader technical indicators suggests that this impressive rally may still represent an early stage of recovery, characterized by inherent price volatility. While the digital asset’s performance has captured significant attention, underlying metrics point to a market grappling with crucial thresholds that will determine the sustainability of its upward trajectory.
The latest price action follows a period of heightened anticipation and significant institutional interest. Earlier in the year, the approval of spot Bitcoin Exchange-Traded Funds (ETFs) in the United States marked a pivotal moment, opening new avenues for traditional investors to gain exposure to the cryptocurrency. This, coupled with the approaching Bitcoin halving event—a pre-programmed reduction in the reward for mining new blocks, historically associated with price appreciation—has created a potent mix of speculative interest and fundamental drivers. The rally to new all-time highs instilled a renewed sense of confidence, prompting many to wonder if Bitcoin was firmly entrenched in a new bull market cycle. However, a deeper dive into market dynamics reveals a more nuanced picture.
Navigating the "Open Zone": Insights from UTXO Realized Price Distribution
According to detailed analysis from Glassnode, a prominent on-chain analytics firm, Bitcoin’s price has entered a relatively "open" zone, specifically ranging between $72,000 and $82,000. This designation implies a region where the asset encounters less significant resistance, potentially allowing for more fluid price movements in the short term, provided current bullish momentum is sustained.
This "open zone" is primarily defined by the UTXO Realized Price Distribution (URPD) metric. URPD provides a granular view of the price at which every unspent transaction output (UTXO) was last moved on the blockchain, effectively illustrating the price points where investors acquired their Bitcoin holdings. When an asset enters a zone with fewer UTXOs accumulated at those specific price levels, it means there are fewer large clusters of supply that might act as immediate support or resistance. In simpler terms, if a significant number of coins were bought at, say, $70,000, then $70,000 would represent strong support if the price falls, or strong resistance if many holders decide to sell at break-even when the price approaches that level from below. The current "open zone" indicates that there are fewer such dense clusters of historical accumulation within this particular range.

For market participants, this reduced resistance can translate into periods of accelerated price discovery. If buying pressure persists and overcomes minor selling, Bitcoin could potentially traverse this range with greater ease than areas where large volumes of coins were accumulated, which often require substantial buying power to overcome. The implication here is that while the path upwards might appear clearer, the underlying volatility characteristic of early-stage recoveries remains a significant factor, as these movements can be swift in both directions.
Market Profitability: A Critical Barometer for Recovery
Beyond immediate price resistance, a more robust signal for a sustained recovery, as emphasized by Glassnode, lies in the broader market’s return to profitability. The share of Bitcoin supply currently held in profit has climbed back to approximately 60%. While this marks a significant improvement from deeper bear market troughs, it is a level frequently observed during the nascent stages of a market recovery rather than a full-blown bull market.
To understand the significance of this metric, consider the psychological aspect of asset holding. When a large percentage of the supply is "underwater" (in loss), holders are often reluctant to sell, leading to illiquidity and potential capitulation events. Conversely, as prices rise and more supply moves into profit, holders regain confidence, but also face the temptation to realize gains. The 60% profitability mark suggests that while a majority of holders are now in profit, a substantial portion (40%) remains at or below their acquisition cost, potentially waiting for higher prices to break even or take profit.
Glassnode’s analysis underscores that a sustained push above 75% profitability would carry considerably more weight as a confirmation of early bull market conditions. Such a level would indicate that a vast majority of the market participants are seeing positive returns on their investments, fostering a stronger sense of collective market health and potentially reducing immediate selling pressure from those seeking to merely recover losses. Conversely, continued rejection near current levels, failing to breach the 75% threshold, would reinforce the narrative of a bear market recovery, suggesting that the current rally is primarily a re-pricing within a broader corrective phase, rather than a definitive shift into a new bullish cycle. Historical data often shows that robust bull markets are characterized by very high percentages of supply in profit, sometimes exceeding 90%, reflecting widespread participation and strong conviction.
Analyzing Short-Term Holder Dynamics and Profit-Taking Pressure

Another crucial element in assessing the current market strength is the behavior of short-term holders (STHs). These are typically defined as entities that have held Bitcoin for less than 155 days and are often more reactive to immediate price fluctuations. As Bitcoin ascended above the $74,000 mark, these STHs began realizing profits at an accelerated pace, with recorded realized gains reaching an impressive $18.4 million per hour.
This intense profit-taking behavior from short-term participants is a critical factor to monitor. It mirrors patterns observed in earlier failed rallies, where investors sold into strength, effectively capping the upside momentum and preventing a sustained breakout. In such scenarios, the influx of sell orders from short-term holders can overwhelm buying demand, leading to price pullbacks or consolidation. The ability of the market to absorb this wave of profit-taking is paramount. If Bitcoin can successfully absorb this selling pressure and maintain a robust support level above $70,000, it significantly increases the probability of extending the rally further into the $78,000 to $82,000 range. This would demonstrate underlying strength and conviction from longer-term holders and new entrants willing to step in and buy at higher prices. However, a failure to hold $70,000 could signal weakness and potentially lead to a deeper correction as short-term holders continue to de-risk.
Technical Analysis: The Broader Trend Structure Remains Cautious
From a purely technical standpoint, the broader trend structure of Bitcoin continues to lean towards caution, despite the recent price gains. On higher time frames, specifically daily and weekly charts, Bitcoin has been observed trading within a pattern of lower highs and lower lows. This classic chart pattern is a hallmark of a bearish market structure, indicating that a definitive bullish market structure has not yet been established.
For a decisive bullish shift, Bitcoin would need to break above its previous significant lower high, which analysts identify near the $97,855 mark. Sustaining price action above this critical level would invalidate the existing bearish pattern and signal a potential reversal in the long-term trend. This level is not merely arbitrary; it represents a key inflection point where sellers previously exerted dominance, preventing further upward movement. A breach of this level would imply a significant shift in market control from sellers to buyers.
This region also conspicuously aligns with the Fibonacci "golden zone," typically defined by the 0.5 and 0.618 retracement levels of a prior significant swing. Fibonacci retracements are a popular technical analysis tool used by traders to identify potential support and resistance levels. The "golden zone" is often tracked as a crucial decision point during trend reversals. A clean breakout above this range, followed by a period of consolidation where the price stabilizes above the newly established support, would strongly suggest robust demand and significantly increase the likelihood of a long-term rally. Such a move would not only break a key technical resistance but also confirm sustained buying interest at elevated levels.

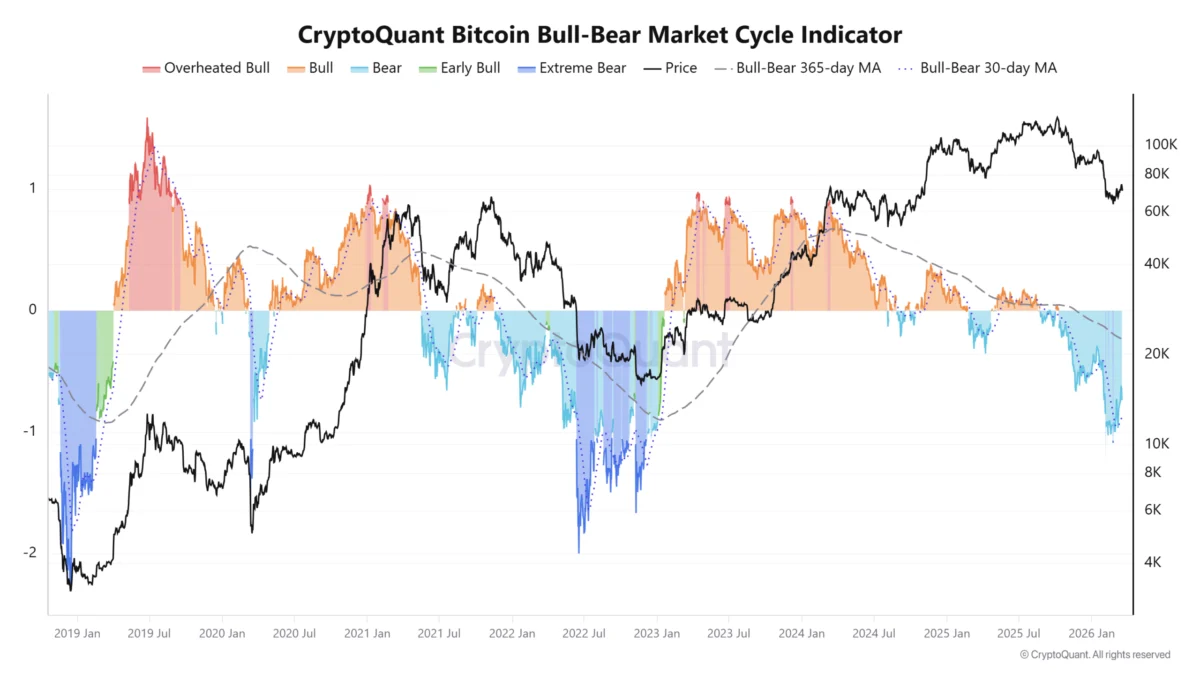
Market Cycle Indicators: Echoes of Caution from CryptoQuant
Further reinforcing this cautious outlook is CryptoQuant’s proprietary Bitcoin Bull-Bear Cycle indicator. This sophisticated metric, designed to provide a macro view of Bitcoin’s market phase, currently remains firmly entrenched in bearish territory. While it has shown a marginal improvement to -0.72 from a previous low of -1 earlier in the month, it is still considerably far from the threshold of 1, which would be required to confirm a full-fledged bull market trend reversal.
The CryptoQuant indicator synthesizes various on-chain and market data points to gauge the overall health and sentiment of the Bitcoin market. Its current reading suggests that while there might be some underlying recovery, the fundamental conditions for a sustained, aggressive bull run are not yet in place. A move above 1 would reflect a period of sustained positive momentum, characterized by strong demand, healthy network activity, and favorable investor behavior that typically accompanies confirmed bull markets.
An earlier, albeit less definitive, signal that market observers are closely watching is a potential move above the bull-bear 365-day moving average, which currently stands at -0.23. This long-term moving average acts as a powerful trend filter, effectively smoothing out short-term market noise and volatility. A sustained move above this level would indicate a significant shift in the underlying long-term market conditions, signaling that the broader trend might be transitioning from bearish to bullish. It serves as an early warning system, suggesting that while a full bull market confirmation may still be distant, the foundational elements for such a shift are beginning to align.
Broader Market Context and Investor Implications
The current scenario for Bitcoin is a complex interplay of optimism and underlying caution. While the rally to $76,000 has undeniably revitalized spirits, the analytical insights from Glassnode and CryptoQuant, coupled with technical chart patterns, provide a sobering reminder of the hurdles that still need to be overcome. The market’s ability to navigate the "open zone" without significant resistance, to push the percentage of supply in profit above 75%, and to absorb the ongoing short-term holder profit-taking will be critical determinants of its near-term trajectory.

Furthermore, recent market events, such as the temporary end of the spot Bitcoin ETF inflow streak, which saw $164 million in outflows amidst a BTC dip, underscore the sensitivity of the market to institutional capital flows. While institutional interest remains a long-term bullish factor, short-term outflows highlight the dynamic nature of demand and supply, even from large players. This interplay of retail enthusiasm, institutional maneuvering, and fundamental on-chain dynamics creates a volatile yet fascinating environment for investors.
For long-term holders (HODLers), these periods of volatility within an early-stage recovery can be seen as opportunities for accumulation, provided they maintain a robust risk management strategy. Short-term traders, on the other hand, must navigate the market with heightened caution, recognizing the potential for swift reversals if key support levels fail or if selling pressure intensifies.
In conclusion, Bitcoin stands at a pivotal juncture. The recent rally is a testament to renewed market interest and the enduring appeal of digital assets. However, the path forward is not without its challenges. The journey from an early-stage recovery to a confirmed bull market will require sustained momentum, robust demand capable of absorbing profit-taking, and decisive breaches of key technical and on-chain thresholds. Until these conditions are met, prudence and a data-driven approach remain paramount for all market participants. The coming weeks and months will undoubtedly provide further clarity on whether this rally is merely a strong rebound within a broader consolidation, or the nascent phase of a truly transformative bull run.