
 Clara Shinta
Bitcoin (BTC) is exhibiting a "perfectly fractal" reversal pattern, according to renowned technical analyst John Bollinger, creator of the widely utilized Bollinger Bands volatility indicator. This observation, coupled with a resurgence of institutional interest evidenced by recent spot Bitcoin Exchange-Traded Fund (ETF) inflows, is fueling cautious optimism that the prolonged bear market could be nearing its conclusion. The confluence of these technical and fundamental signals presents a complex but potentially pivotal moment for the leading cryptocurrency.
Bollinger’s "W" Reversal Pattern Signals Potential Trend Shift
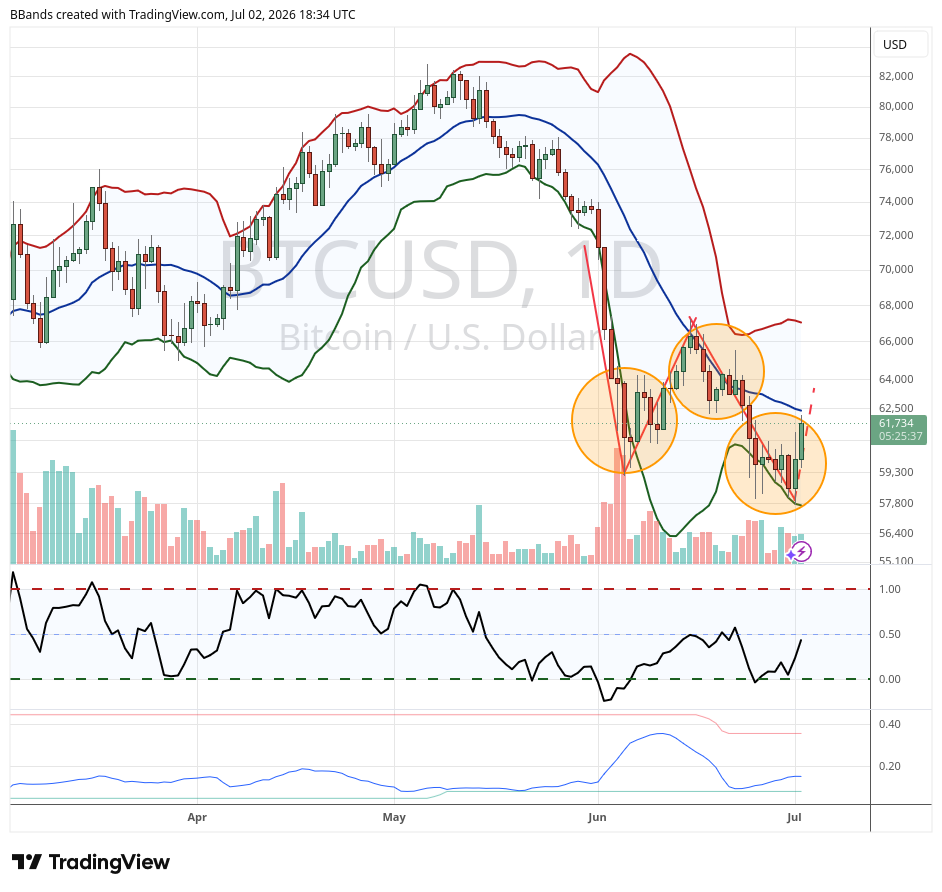
In a series of posts on the social media platform X (formerly Twitter) on Friday, John Bollinger drew attention to a distinct "W"-shaped double bottom formation on the BTC/USD daily chart. This pattern, a classic indicator of a potential bullish reversal, involves two significant swing lows separated by a rejected rebound, with the price ultimately breaking above the resistance level established by that rebound, signaling the initiation of an uptrend.
Bollinger, a respected figure in financial analysis, noted the challenge Bitcoin has faced in establishing upward momentum during the current downturn. "BTC has seen a series of bullish patterns broken, evidence of the power of the downtrend," he commented, underscoring the resilience of the bearish sentiment that has dominated the market. However, his subsequent query — "Will this ‘W’ be the one that breaks the trend?" — highlights the potential significance he attributes to this particular formation.
Crucially, Bollinger elaborated on the intricate nature of the current setup, describing it as "perfectly fractal." In technical analysis, fractals refer to repeating patterns at different scales, indicating a deep-seated structural characteristic within the market’s price action. Bollinger pointed out the presence of "small ‘w’s at the nadirs and a small ‘m’ at the apex" within the larger "W" pattern on the daily chart, and further noted a similar "W" formation appearing on the weekly chart. This multi-timeframe confirmation amplifies the pattern’s potential reliability, suggesting a consistent underlying market dynamic.
He further supported his analysis by uploading a chart illustrating how precisely the current price action aligns with the lower band of the Bollinger Bands indicator on daily time frames. Bollinger Bands are a type of statistical chart developed by Bollinger himself, used to measure market volatility and identify overbought or oversold conditions. The price touching or breaking the lower band often suggests that an asset is oversold and might be due for a rebound, making its alignment with a "W" reversal pattern particularly noteworthy.
Bollinger’s current stance is consistent with his recent sentiment regarding Bitcoin. In early May, he publicly disclosed opening a new long position via his Bitcoin investment vehicle, indicating a personal conviction in the asset’s potential for appreciation. His long-standing expertise and the self-referential nature of his analysis (using his own indicator) lend significant weight to his observations within the cryptocurrency trading community.

Understanding the "W" Pattern and Fractal Analysis
To fully appreciate Bollinger’s insights, it is essential to understand the technical components he references. A "W" pattern, or double bottom, is characterized by:
- First Low: A significant price decline followed by a modest rebound.
- Intermediate Peak (Apex): The high point of the rebound, representing a temporary resistance level.
- Second Low: Another decline that tests the previous low, ideally forming near the same price level or slightly higher, indicating buyer support at that level.
- Breakout: The price then rises, breaking decisively above the intermediate peak (neckline), confirming the reversal.
The "perfectly fractal" nature described by Bollinger adds another layer of sophistication. Fractal patterns imply that market behavior is self-similar across different time scales. This means that a pattern observed on a daily chart might also be discernible, albeit in a smaller form, on hourly charts, and similarly, a larger version might exist on weekly or monthly charts. For traders, this self-similarity can enhance the predictability of patterns, as a pattern confirmed across multiple timeframes is generally considered more robust. Bollinger’s identification of smaller "w" shapes at the pattern’s lows (nadirs) and an "m" shape (double top, a reversal pattern for uptrends) at the intermediate peak (apex) within the larger "W" underscores this fractal complexity, suggesting a deeply embedded structural reversal rather than a superficial one.
Broader Market Indicators and Conflicting Sentiment
Bollinger’s analysis arrives at a time when other on-chain and technical indicators are also flashing signals reminiscent of previous bear market bottoms. As reported by various market analysts, an increasing number of Bitcoin price indicators have recently printed "buy signals" not witnessed since the depths of the last significant bear market in late 2022. These indicators often include metrics related to miner capitulation, long-term holder behavior, and various oscillator readings, all of which historically precede major market reversals.
Despite these potentially bullish technical signals, a significant portion of market participants maintains a more cautious outlook. Many analysts and traders broadly believe that the ultimate "macro bottom" for Bitcoin’s current cycle is yet to materialize. Forecasts often point to a potential bottoming out in Q3 or later in the year, with price targets frequently cited around the $50,000 mark. This divergence in sentiment—between immediate technical bullishness and longer-term bearish caution—highlights the inherent uncertainty and complexity of predicting market movements in volatile asset classes like cryptocurrencies. The expectation of a deeper dip is often attributed to factors such as ongoing macroeconomic uncertainties, potential further liquidity grabs, or a prolonged "squeezing out" of weaker hands before a sustainable uptrend can begin.
Institutional Re-Engagement and ETF Inflows
Adding a crucial fundamental layer to the technical observations, renewed institutional buyer interest is becoming increasingly apparent. Axel Adler Jr., a contributor to the on-chain analytics platform CryptoQuant, emphasized the significance of this re-emerging capital. His analysis suggests that while Bitcoin may be in the latter stages of its bear cycle, the recent performance of the US spot Bitcoin ETF segment provides a concrete signal that selling pressure is beginning to ease.
On Friday, the US spot Bitcoin ETFs recorded their first net inflows in ten days, a noteworthy development following a period characterized by consistent outflows. The launch of these ETFs in January 2024 was heralded as a landmark event, opening the door for traditional financial institutions and retail investors to gain exposure to Bitcoin without directly holding the asset. Initially, these ETFs saw massive inflows, driving Bitcoin to new all-time highs. However, recent weeks have seen a cooling off, with outflows dominating, largely attributed to factors such as profit-taking, broader market risk-off sentiment, or rebalancing by institutional players. The reversal to net inflows, albeit modest, signals a potential shift in this dynamic.
Trader Daan Crypto Trades acknowledged that the $220 million in net inflows on Friday might not be "massive" in the grand scheme of institutional capital movements, but he underscored its potential implications for BTC price support moving forward. His perspective centers on the concept of "supply absorption." "Also good to note how price has been holding this ~$60K region regardless of the many outflows. That will become meaningful if price does bounce further into next week as it means a lot of absorption has taken place," he explained to his followers on X.
Supply absorption refers to a market condition where persistent buying interest, often from strong hands (institutions, long-term holders), effectively soaks up selling pressure without a significant drop in price. Even with outflows from certain segments, if the price remains relatively stable or shows resilience, it indicates that underlying demand is robust enough to absorb the available supply. This suggests that the $60,000 price region, despite being tested by outflows, has strong buyer interest, acting as a crucial support level. If this absorption continues and is followed by sustained inflows, it could lay the groundwork for a more significant price recovery.
The Broader Impact and Implications
The interplay between Bollinger’s technical analysis and the renewed ETF inflows presents a compelling narrative for Bitcoin’s immediate future. If the "W" reversal pattern successfully breaks the prevailing downtrend, it could usher in a new phase of bullish momentum. For this to occur, Bitcoin would need to decisively break above the neckline resistance of the "W" pattern, which would likely coincide with significant price movement beyond the current consolidation range.
The role of institutional capital, channeled through spot Bitcoin ETFs, cannot be overstated. While the current inflows are not record-breaking, their re-emergence after a period of outflows suggests a cautious return of institutional confidence or strategic re-entry points. Sustained inflows would provide a strong fundamental tailwind, injecting fresh capital into the market and potentially validating higher price levels. Institutional participation also lends greater legitimacy and stability to the cryptocurrency market, potentially attracting more mainstream investors.
However, the path forward is not without challenges. The broader macroeconomic environment, including inflation trends, interest rate decisions by central banks, and geopolitical events, continues to exert influence on risk assets like Bitcoin. A worsening global economic outlook could quickly dampen bullish sentiment, irrespective of technical patterns or ETF flows. Moreover, the cryptocurrency market remains inherently volatile, subject to rapid price swings and unexpected developments.
The current situation highlights a classic market struggle: the battle between technical indicators suggesting a potential reversal and a prevailing sentiment that anticipates further downside. For investors, this period necessitates careful observation, combining insights from both technical and fundamental analysis. Should Bollinger’s "W" pattern confirm its breakout, and should ETF inflows continue to build momentum, the narrative around Bitcoin could swiftly shift from bear market apprehension to the nascent stages of a new bullish cycle. Conversely, a failure of the pattern or a return to ETF outflows would reinforce the cautious sentiment, potentially leading to the deeper macro bottom many still anticipate.
In conclusion, John Bollinger’s identification of a "perfectly fractal" "W" reversal pattern on Bitcoin charts, coupled with the recent resumption of net inflows into US spot Bitcoin ETFs, provides a glimmer of hope for an end to the current bear market. While these signals are promising, the market remains a complex interplay of technical structures, institutional capital flows, and broader economic forces. Investors and analysts will be closely monitoring price action and capital movements in the coming days and weeks to determine whether these nascent bullish indicators can truly break the power of the downtrend and pave the way for a sustained recovery.
This article is produced in accordance with Cointelegraph’s Editorial Policy and is intended for informational purposes only. It does not constitute investment advice or recommendations. All investments and trades carry risk; readers are encouraged to conduct independent research.